
Every SEO agency hears the same question, usually in month two or three: “We’ve been paying for this for three months and we’re not ranking yet. Is this actually working?”
- Why SEO ROI is harder to prove than it should be
- The four-phase ROI communication framework
- The metrics that actually persuade clients and the ones that don’t
- Handling the most common client objections
- Using Google Search Console’s AI Performance Reports
- Building the reporting infrastructure
- SEO ROI benchmarks by industry
- Frequently Asked Questions
- How do you calculate SEO ROI for clients?
- How long does it take for SEO to show ROI?
- What metrics should agencies use to prove SEO ROI to clients?
- How do you handle clients who say SEO isn’t working after three months?
- Can agencies include AI search visibility in SEO ROI reports?
- What is the average SEO conversion rate?
- Conclusion
The agencies that lose clients to this question are not necessarily doing worse SEO than the agencies that keep them. They are doing worse reporting. Over a third of marketers rarely or never track SEO ROI according to consistent industry survey data which means a significant share of agencies are making the client’s trust a matter of faith rather than evidence.
The agencies with the highest retention rates share one characteristic: they never put a client in the position of having to wonder whether SEO is working. They show it, consistently, in the language the client actually uses not impressions and keyword counts, but leads, revenue, and competitive advantage.
This guide covers how to build the measurement framework that makes SEO ROI visible, how to handle the objections every agency faces, and how to include AI search visibility data which Google Search Console now tracks directly in a way that positions your agency as ahead of where the industry is going.
Why SEO ROI is harder to prove than it should be
SEO has a structural communication problem that other marketing channels don’t share. When a client runs Google Ads, every conversion has a last-click attribution path. When they run email marketing, the open rate and click rate are immediate and visible. When they invest in SEO, the results compound over time, attribution is messy, and the work happens invisibly crawl fixes, internal linking, content restructuring in ways that are genuinely difficult to connect to the revenue line without a deliberate measurement framework.
An internal study of 80 US e-commerce sites across five sectors found that average SEO ROI at six months is 0.8x meaning early returns are modest, primarily from technical SEO and easily optimised content. By 12 months, ROI compounds substantially as rankings strengthen and organic traffic scales. By 24 months, SEO consistently outperforms paid channels on a cost-per-conversion basis in most industries.
The problem is that clients often cancel during the early months, before the compounding has had time to work. They cancel not because the SEO was bad, but because nobody showed them the progress happening beneath the surface.The technical health improvements, the crawl rate increases, the rankings moving from position 45 to position 18 on terms that will matter when they reach page one.
Proving SEO ROI is not a data problem. Every agency has access to enough data. It is a translation problem translating technical progress into business language before the client runs out of patience.
The four-phase ROI communication framework
The most effective agencies structure their client communication around four distinct phases, each matched to what is actually happening in the SEO work at that stage.
Phase 1 — Foundation (months 1–3): show progress, not results
In the first three months, meaningful ranking improvements are rare for most sites. The work is technical fixing crawl issues, improving site structure, building content infrastructure, establishing baseline measurements. If you wait for rankings to move before communicating value, you will lose clients in this window.
What to show instead:
Technical health score improvement. If a site had 47 critical issues in month one and has 12 in month three, that is visible, measurable progress that directly predicts future ranking improvement. Show the before and after using your audit tool. A client can understand “we fixed the issues preventing Google from accessing 23% of your pages” even if they cannot interpret a keyword ranking report.
Crawl rate increases. Search Console’s crawl stats show how frequently Googlebot is visiting the site. A rising crawl rate following technical fixes is a leading indicator of improved indexing and it is a metric that moves in the early months when rankings haven’t yet.
Pages indexed count. If the site had 40 indexed pages in month one and 78 in month three because you fixed sitemap and crawlability issues, that is a concrete outcome with an obvious relationship to future visibility.
The communication principle for Phase 1: report on inputs and leading indicators, not lagging ones. Rankings and traffic are lagging indicators. Technical health and crawl activity are leading ones, and they move faster.
Phase 2 — Early traction (months 3–6): connect movement to intent
By month three to six, most sites that received good technical and content work begin showing ranking movement on lower-competition terms. This is the phase where the connection between SEO activity and business intent becomes possible to demonstrate.
Rank movement on target terms. Not “we rank for 200 keywords” that is a vanity metric. Instead: “The three terms your sales team told us drive qualified inbound leads moved from positions 34, 51, and 62 in month one to positions 11, 19, and 28 this month. At current velocity, two of those three terms reach page one within the next 60 days.”
Organic session quality. Use GA4 to show that organic visitors from specific pages have longer session durations, lower bounce rates, and higher goal completion rates than the site’s average. This connects content work to qualified traffic not just volume.
AI visibility emergence. If you have added FAQ schema and restructured content for AEO, this is the phase where AI Overview impressions begin appearing in Search Console. Google launched AI Performance Reports in Search Console on June 3, 2026 a dedicated section showing impressions and clicks specifically from AI Overviews. If you have done AEO work, this data is now directly reportable. The AEO checker at SEO Inspector Hub measures where each page stands on this run key pages through our free AEO checker and include the scores in your monthly report.
Phase 3 — Results (months 6–12): tie it to revenue
By month six, most well-executed SEO campaigns have enough data to make revenue attribution credible. This is when the reporting narrative shifts from “look at the progress we’re making” to “look at what that progress is generating.”
Organic conversion tracking in GA4. Set up goal completions or conversion events specifically for organic traffic. Report not just how many organic sessions occurred, but how many of those sessions converted to leads, to purchases, to phone calls, to form submissions. The metric that matters to a client is not “we got 3,400 organic visits”. It is “3,400 organic visits produced 68 form submissions at an implied cost per lead of £22, compared to your Google Ads cost per lead of £47.”
Revenue attribution. For e-commerce clients, GA4 makes direct organic revenue attribution straightforward. For service businesses, connect Search Console and GA4 data to your client’s CRM even a manual match of “organic lead that month” to “closed deals from those leads” produces attribution data that justifies the retainer far more convincingly than any traffic chart.
SEO vs paid channel comparison. SEO consistently outperforms paid search on cost-per-lead and cost-per-acquisition once sufficient time has passed. Hallam’s 2026 ROI review confirms that although PPC delivers immediate conversions, SEO delivers stronger long-term ROI because organic traffic compounds without incremental spend. Showing this comparison even as a projection rather than an absolute reframes the retainer as an investment with a measurable return rather than a cost with unclear benefit.
Phase 4 — Partnership (ongoing): show what comes next
The agencies with the highest long-term retention do not just report on what happened. They project what comes next. A quarterly forward projection “at current ranking trajectory, organic traffic is projected to increase 34% over the next 90 days, representing approximately £X in conversion value at your current organic conversion rate” transforms the agency relationship from vendor to strategic partner.
Clients who can see a credible forward projection cancel at dramatically lower rates than clients who only receive backward-looking reports. The projection shows you understand their business well enough to model its growth, not just measure its current state.
The metrics that actually persuade clients and the ones that don’t
Research on working memory from cognitive psychology finds that people process five to seven items simultaneously before attention degrades. This is directly relevant to client reporting. A monthly report with 23 metrics produces the same outcome as a report with none. The client cannot identify which number matters and defaults to “I’m not sure if this is working.”
The test for any metric before it goes in a client report: does this help my client make a decision? If the answer is no, it belongs in an appendix or a live dashboard, not in the main report.
Metrics that persuade – keep these front and centre:
| Metric | Why clients understand it |
|---|---|
| Organic leads this month vs last month | Direct business outcome, no SEO knowledge required |
| Cost per organic lead vs cost per paid lead | Speaks the language of every client who also runs paid ads |
| Pages indexed this month vs last month | Concrete progress metric, understandable to non-technical readers |
| Target keyword position movement | Specific terms they care about, not an aggregate average |
| AI Overview impressions (from Search Console) | Answers the question they’re already asking about AI visibility |
| AEO score improvement | Measurable progress on the AI readiness work you’re doing |
| Technical issues resolved | Shows active work, not passive monitoring |
Metrics that confuse move these to the appendix:
| Metric | Why it fails to persuade |
|---|---|
| Domain authority score | Not a Google ranking factor; different tools give different numbers |
| Total keyword count | Quantity with no quality context means nothing |
| Bounce rate as a standalone metric | Google removed it from ranking signals; clients misinterpret it |
| Raw backlink count | Without quality context, this is noise |
| Keyword density percentages | No client has ever renewed a contract because of keyword density |
| Impressions without position context | High impressions at position 70 is meaningless |
Handling the most common client objections
Every agency faces the same three objections. Having a prepared, evidence-based response to each one is the difference between a retained client and a churned one.
“We’ve been paying for three months and we’re not ranking yet.”
This objection exists because the client’s expectation was never set correctly. The response is partly a reporting fix and partly an onboarding fix.
The reporting response: show the Phase 1 leading indicators technical health score improvement, crawl rate increase, indexed page count. Explain that these are the foundation that rankings build on: “In month one, Google could access 68% of your pages. It can now access 94% of them. The ranking movement we’re projecting for month four is directly dependent on that foundation being in place.”
The forward projection response: give them a specific timeline. Not a guarantee a model. “Based on the current ranking velocity for your three priority terms, we project page one visibility on two of the three within 60 days. Here’s what that would mean in terms of estimated traffic at the industry average CTR for those positions.”
The onboarding fix: in the first session with every new client, establish the 6-to-12 month expectation explicitly. Show them the Incremys benchmark data 0.8x ROI at 6 months, compound growth through 12 and 24 months. Clients who understood from the start that early months are foundation-building do not send this email in month three.
“I can get the same results cheaper elsewhere.”
This objection is about perceived value, not price. The response is a comparison specifically, the cost-per-lead comparison between your SEO work and whatever alternative they’re considering.
“Your current organic cost-per-lead is £22, based on 68 leads last quarter from organic traffic at your current retainer cost. The average cost-per-lead from Google Ads in your industry is £47 per lead. The SEO retainer produces leads at less than half the cost of your paid alternative and unlike paid, the leads don’t stop when the budget stops.”
That is not a conversation about your credentials. It is a conversation about their numbers. Numbers win.
“Our competitors are ranking above us why aren’t we there yet?”
This objection is an opportunity. The response involves a competitive gap analysis that shows exactly what the competitor has that your client currently doesn’t and what you’re doing to close it.
“Your top competitor for [keyword] has 47 indexed pages on this topic, 312 referring domains, and a page speed score of 89. You currently have 12 pages, 41 referring domains, and a page speed score of 71. Here’s the 90-day plan for closing the gaps that are most within our control.”
Specificity turns frustration into a roadmap. A client who can see the gap and the plan for closing it is far less likely to cancel than one who receives a vague reassurance that things will improve.
Using Google Search Console’s AI Performance Reports
Google launched AI Performance Reports in Search Console on June 3, 2026. This is a dedicated section within the Performance report that shows impressions and clicks specifically from AI-generated answers separate from traditional organic results.
For agencies, this data is immediately reportable and directly addresses the question every client with AI-literate leadership is already asking: “Are we showing up in AI answers?”
To access it:
- Open Google Search Console
- Go to Performance → Search results
- Click the “Search type” filter
- Select “AI Overviews”
The report shows which queries triggered an AI Overview that included your site, how many impressions those generated, and how many clicks came through. For clients who have seen their traditional click-through rates declining as AI Overviews absorb more results, this data contextualises the trend — and the AEO work you have been doing becomes measurable in a new way.
For pages where you have improved AEO scores, comparing AI Overview impressions before and after the structural changes provides one of the clearest possible demonstrations that AEO work is producing results. Run your client’s key pages through our free AEO checker to get a baseline score, then track the change alongside Search Console AI data monthly.
For the full guide on what AEO involves and how to improve scores specifically, our complete AEO guide covers every signal. For the broader AI search visibility picture including GEO and cross-platform citation, see our LLM SEO guide.
Building the reporting infrastructure
The agencies that prove ROI most consistently do not produce reports manually each month. They build a reporting infrastructure that generates the right data automatically, leaving agency time for the interpretation and strategic narrative that automation cannot provide.
The four-layer reporting stack:
Layer 1 — Data collection: Google Search Console (organic and AI visibility), GA4 (sessions, conversions, revenue), your SEO platform (rankings, technical health, backlinks), client CRM if available (lead quality and close rate by source).
Layer 2 — Aggregation: Looker Studio (free) connects all four data sources into a single dashboard. For agencies managing 10+ clients, AgencyAnalytics or SE Ranking’s client portal automate the aggregation across all accounts simultaneously.
Layer 3 — Branded report generation: White label PDF export from SEO Inspector Hub’s free SEO audit tool covers technical health, AEO score, GEO readiness, and Core Web Vitals. All in a branded report under your agency name. For a full comparison of white label reporting tools and what each covers, see our white label tool comparison.
Layer 4 — Narrative layer: The executive summary and key insights that automation cannot write. Two paragraphs per client, per month what moved, why it moved, and what happens next. This is the layer that justifies the retainer, and it is also the layer that takes the least time when the data infrastructure underneath it is working correctly.
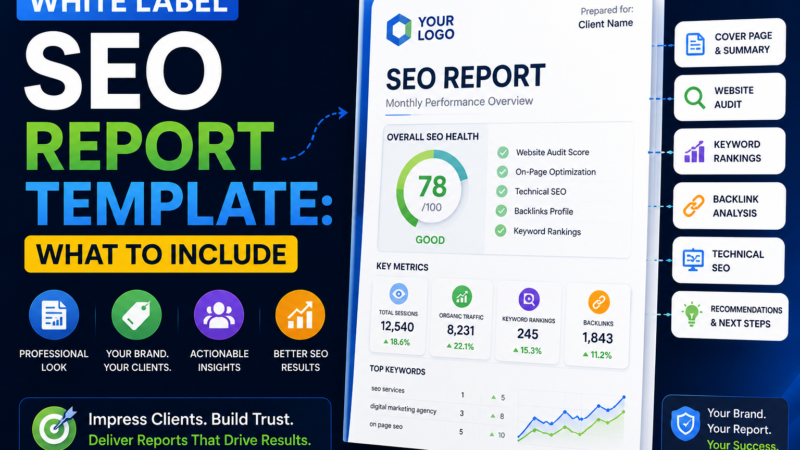
For the complete framework on structuring client-facing white label reports what to include, how to order it, and how to present technical findings in business language our white label SEO reporting guide covers every section in detail.
SEO ROI benchmarks by industry
Not every industry generates the same ROI from SEO, and setting client expectations against the correct benchmarks prevents the comparison problem. When a SaaS client compares their SEO ROI to e-commerce benchmarks, they are comparing different economic models.
| Industry | Typical SEO ROI (12 months) | Why it varies |
|---|---|---|
| Finance / Insurance | Highest — each converted customer has significant lifetime value | High CPC in paid search makes organic cost-per-lead comparison most favourable |
| SaaS / Software | Very high — trial signups from organic have low CAC vs LTV | Content-driven SaaS converts organic visitors at above-average rates |
| Professional services (legal, accounting) | High — organic leads close at high rates | Long buying cycles mean SEO investment compounds more than in high-frequency categories |
| E-commerce | Moderate early, compounds strongly after 12 months | Volume-dependent ROI; requires significant keyword and content investment for scale |
| Local services | Variable — high in competitive markets, faster in underserved niches | Google Business Profile integration amplifies local SEO ROI |
| Healthcare / Medical | High once achieved — YMYL category has high intent signals | E-E-A-T requirements make the investment heavier upfront |
FirstPageSage data places the average SEO conversion rate at 2.4% across industries. Against a paid search average of 3.6% click-through rate but significantly higher cost-per-click, SEO’s lower conversion rate is often offset by volume and compounding producing better long-term cost-per-acquisition for the majority of categories.
Frequently Asked Questions
How do you calculate SEO ROI for clients?
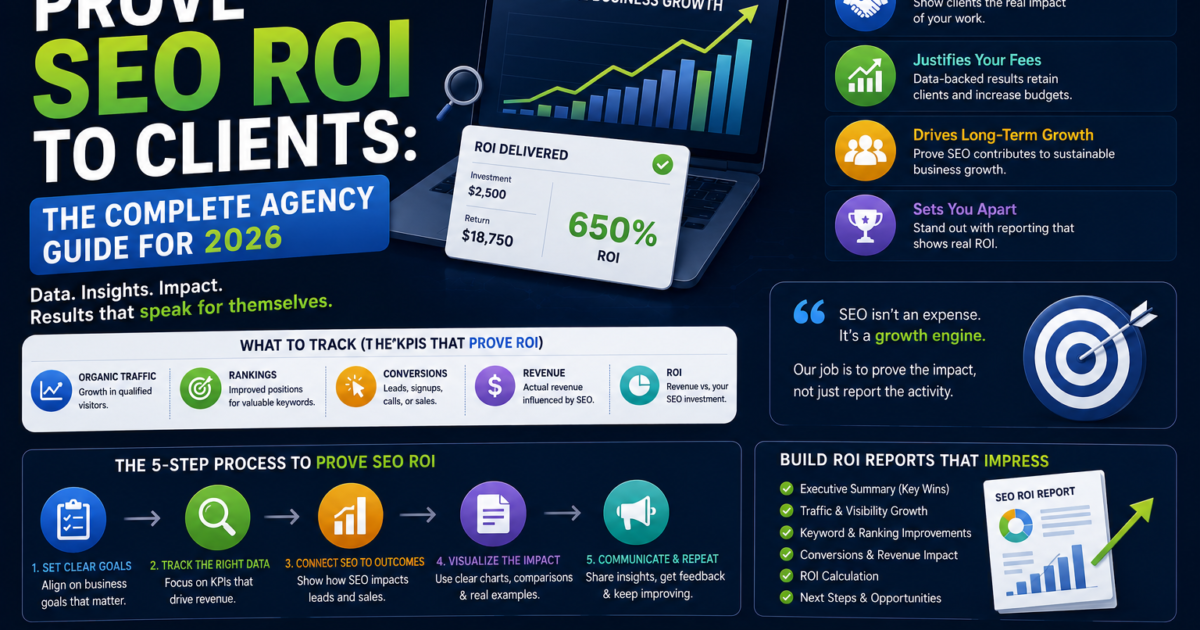
SEO ROI is calculated as (revenue attributable to organic traffic minus total SEO investment) divided by total SEO investment, expressed as a percentage. Total SEO investment includes agency fees, content production costs, and any technical improvements. Revenue attributable to organic traffic comes from GA4 conversion tracking, filtered to the organic source, then multiplied by average deal value or average order value. For lead-generation businesses, multiply organic leads by average close rate and average deal value to estimate organic revenue.
How long does it take for SEO to show ROI?
Research benchmarks from an 80-site US e-commerce study found average SEO ROI at six months is 0.8x modest early returns from technical improvements and easily optimised content. ROI compounds substantially through 12 months as rankings strengthen and through 24 months as organic traffic scales. Agencies that set client expectations against these benchmarks at onboarding have significantly lower month-three churn than those that do not.
What metrics should agencies use to prove SEO ROI to clients?
The most persuasive metrics are those that connect directly to business outcomes: organic leads generated this month, cost per organic lead versus paid alternatives, pages successfully indexed, movement on specific target keywords, and AI Overview impressions from Search Console’s new AI Performance Reports. Metrics to deprioritise include domain authority scores, total keyword counts, bounce rate as a standalone metric, and raw backlink counts without quality context.
How do you handle clients who say SEO isn’t working after three months?
The most effective response combines leading indicator data with forward projection. Show technical health improvements, crawl rate increases, and indexed page counts. These move in the first three months even when rankings don’t. Then provide a specific ranking velocity projection: “Based on current movement, terms X and Y reach page one within 60 days, which we project will generate approximately Z additional leads per month at your current conversion rate.” Specificity prevents the conversation from becoming a debate about whether SEO works in general.
Can agencies include AI search visibility in SEO ROI reports?
Yes, and in 2026 this has become increasingly important. Google Search Console launched AI Performance Reports on June 3, 2026, providing a dedicated view of impressions and clicks from AI Overviews. Agencies can now report directly on AI search visibility alongside traditional organic performance. AEO scores are measurable with tools like SEO Inspector Hub’s free AEO checker provide a month-on-month progress metric for the AI readiness work that is increasingly part of an SEO agency’s remit.
What is the average SEO conversion rate?
FirstPageSage data places the average SEO conversion rate at 2.4% across industries. This varies significantly by category finance and professional services tend to convert above average, e-commerce below average. The more useful comparison for client reporting is not the industry average but the client’s own organic conversion rate versus their paid conversion rate, which removes industry variation and focuses on what matters to that specific business.
Conclusion
Proving SEO ROI to clients is not a measurement challenge. The data exists. It is a communication challenge translating technical progress into business language, at the right frequency, in a format a non-technical client can act on.
The agencies that retain clients through early months are the ones that built the Phase 1 leading indicator narrative before the client started wondering. The agencies that retain clients through year two are the ones that shifted to revenue attribution before the client found a cheaper alternative. The agencies that retain clients indefinitely are the ones that added forward projection turning reporting from a review of the past into a plan for the future.
The reporting infrastructure for all of this — branded audits, AEO scores, technical health tracking, white label PDF export is available free through SEO Inspector Hub. The strategic layer on top of that infrastructure is what the client is paying for. Make it visible every month.
Run a free white label SEO audit for your client →
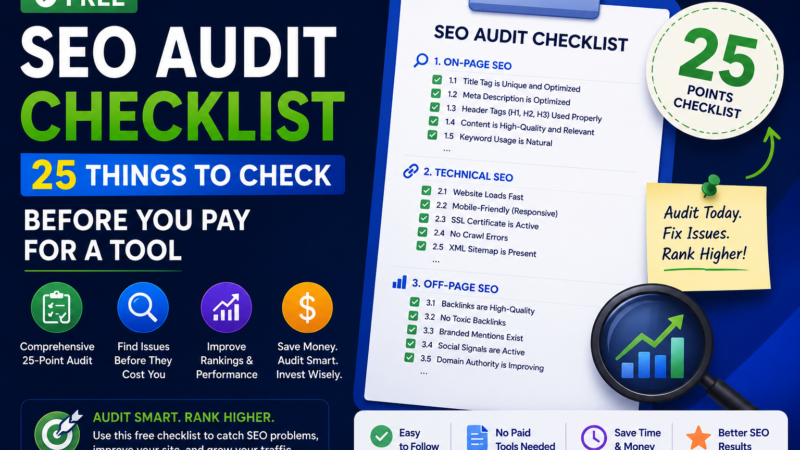
Related guides: White Label SEO Reporting: The Complete Agency Guide · Free White Label SEO Audit Tools Comparison · What is AEO? · LLM SEO Guide · Free SEO Audit Checklist
Related tools: Free SEO Audit Tool · AEO Checker · GEO Checker · White Label SEO Reports